The 60/40 portfolio is a ghost
It haunts every pension fund in the OECD. For three years, the correlation between equities and fixed income has remained stubbornly positive. This is the noise William Marshall wants us to ignore. The Goldman Sachs head of US Rates Strategy issued a warning on June 3. He suggests the signal is finally changing. But the data tells a darker story. Modern portfolios are built on the assumption that bonds act as a ballast. When stocks sink, bonds should float. That mechanism is broken. We are witnessing a fundamental repricing of risk that ignores the traditional playbook.
The Goldman Signal
Marshall’s commentary arrives at a volatile juncture. The market is currently digesting a series of hawkish signals from the Federal Reserve. On June 3, Goldman Sachs Research released a note questioning if bonds can still help balance portfolios. The timing is not accidental. The 10-year Treasury yield is hovering near 4.85 percent. Investors are paralyzed. They are caught between the fear of missing a peak in yields and the terror of a further sell-off. Marshall argues for separating the signal from the noise. To a cynical observer, the signal is clear. The term premium is returning with a vengeance. This is the extra compensation investors demand for holding long-term debt instead of rolling over short-term bills.
The Correlation Breakdown
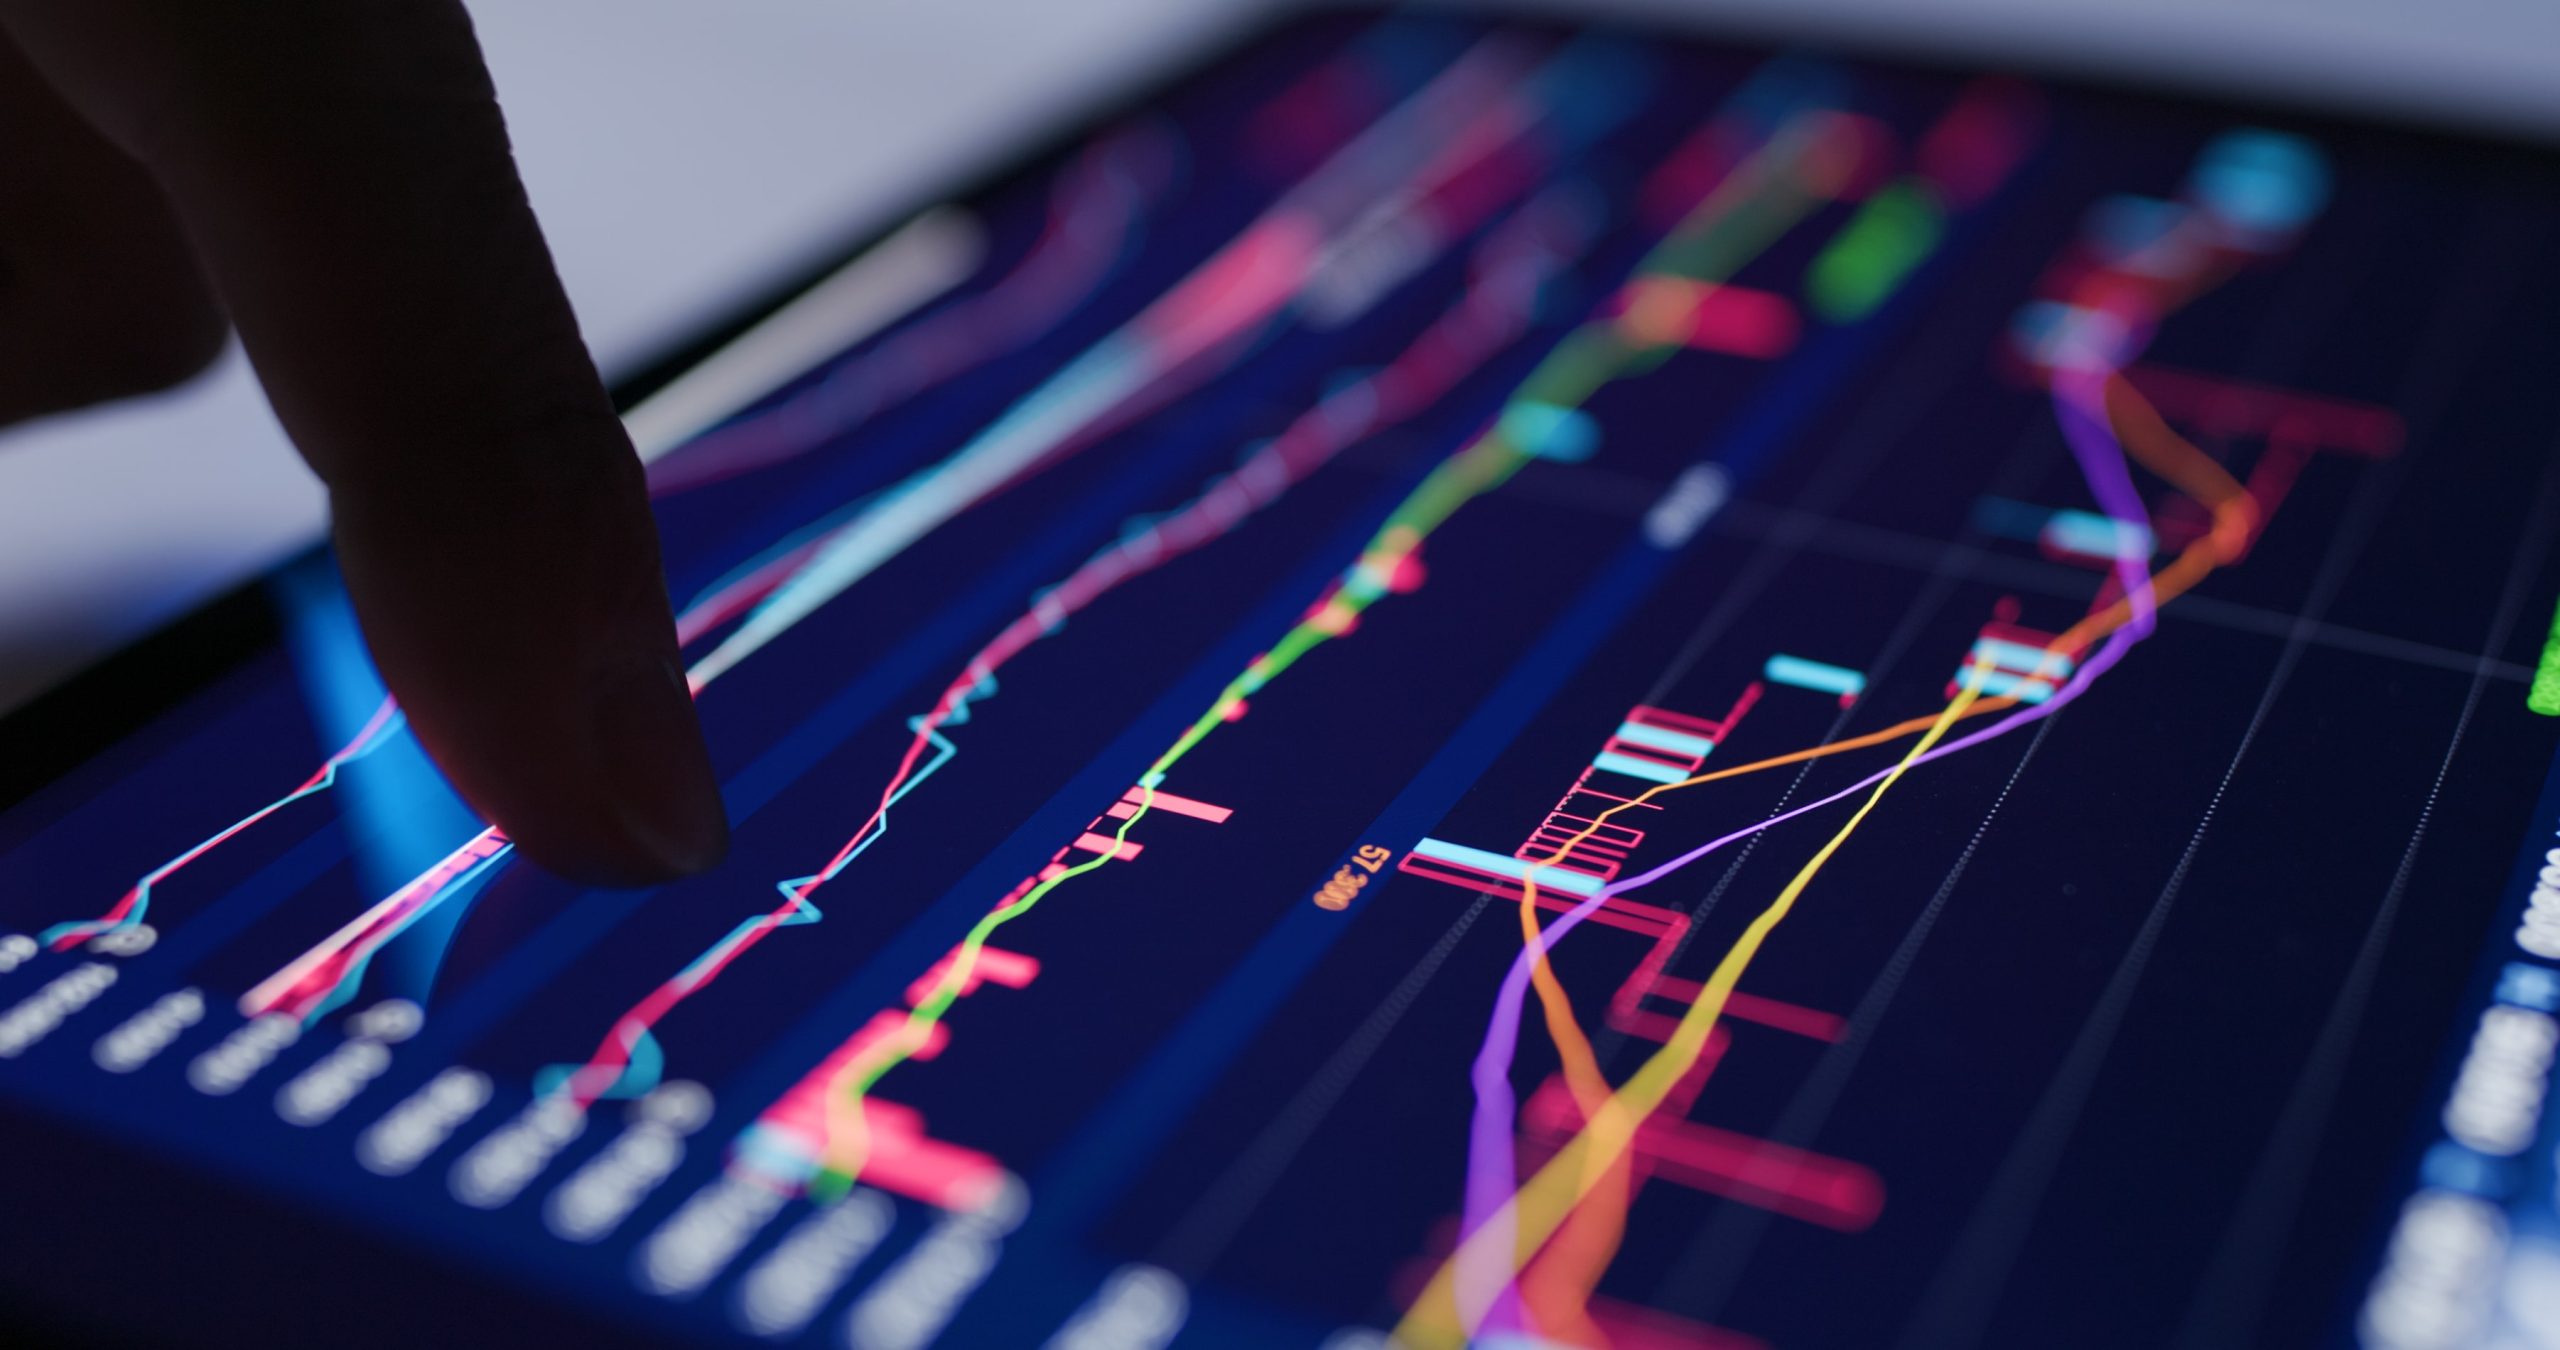
The math is unforgiving. Historically, the correlation between the S&P 500 and the 10-year Treasury was negative. This provided the legendary diversification benefit. Today, that correlation is positive 0.4. When the tech sector wobbles, the bond market follows it down. This happens because both asset classes are now hyper-sensitive to the same variable: the terminal rate. According to recent Bloomberg market data, the MOVE Index, which measures bond market volatility, has spiked 15 percent in the last 48 hours. High volatility destroys the hedging utility of fixed income. If a bond moves as violently as a stock, it is no longer a hedge. It is just another volatile asset in a different wrapper.
Treasury Yield Curve Benchmarks June 5
The following table illustrates the current state of the US Treasury market as of today’s opening bell. The inversion remains the dominant feature of the landscape.
| Maturity | Yield (%) | Change (bps) | Status |
|---|---|---|---|
| 2-Year Treasury | 5.12 | +4 | Inverted |
| 5-Year Treasury | 4.92 | +2 | Inverted |
| 10-Year Treasury | 4.85 | -1 | Benchmark |
| 30-Year Treasury | 4.78 | -3 | Flat |
The Technical Mechanism of the Yield Trap
Duration is a double-edged sword. It measures a bond’s sensitivity to interest rate changes. In a falling rate environment, high duration is a gift. In the current environment, it is a liability. The market is currently pricing in a higher-for-longer scenario that refuses to die. This is the “noise” Marshall references. Traders are obsessed with every minor data point from the Labor Department. They ignore the structural shift in global capital flows. Central banks are no longer the price-insensitive buyers they once were. Quantitative Tightening (QT) has removed the primary safety net. Without the Fed as a buyer of last resort, the market must find its own clearing price. This price is significantly lower than current levels, implying yields have more room to run.
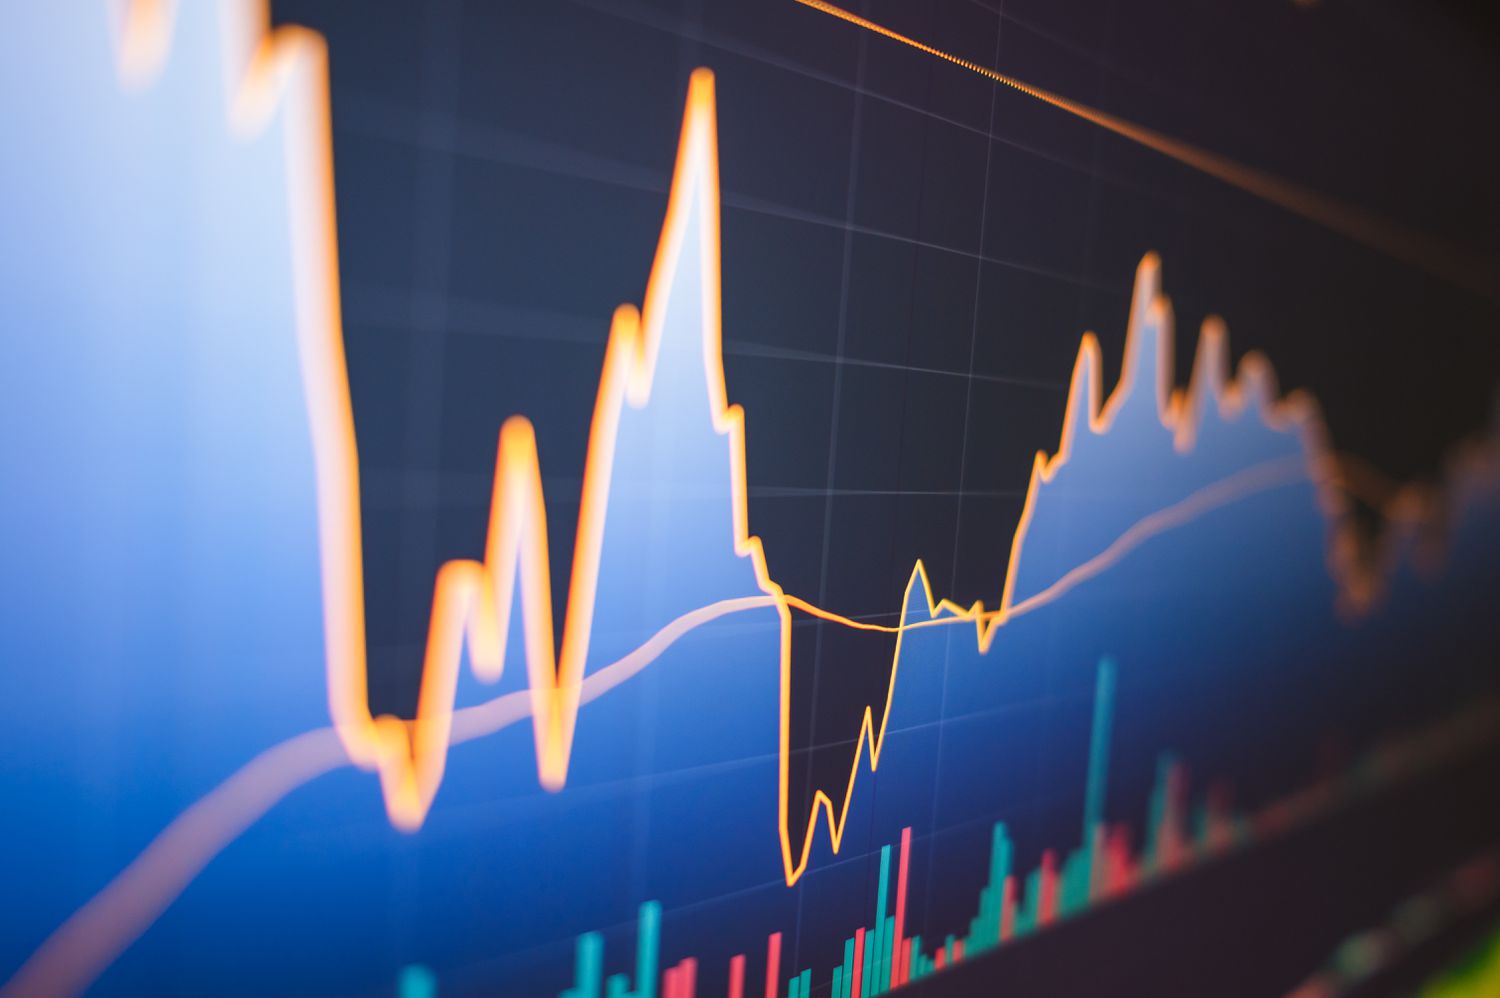
US Treasury Yield Volatility June 3 to June 5
Liquidity and the Shadow Market
Liquidity is vanishing. It is the most critical metric that retail investors ignore. When liquidity dries up, bid-ask spreads widen. This makes it expensive to exit positions. Large institutional players are currently trapped in long-duration positions they cannot liquidate without triggering a massive price collapse. This is why the messaging from firms like Goldman Sachs is so nuanced. They must manage the narrative to prevent a disorderly exit. Per Reuters Financial reports, the volume of off-the-run Treasuries being traded has hit a five-year low. This suggests that the “signal” Marshall is looking for might actually be a warning of a systemic liquidity crunch. If the 10-year yield breaches the psychological 5.0 percent barrier, the automated selling programs will trigger. That is the real noise the market should fear.
The Path Ahead
The market is waiting for a catalyst. The upcoming Treasury auction on June 12 will be the ultimate test of demand. If the bid-to-cover ratio falls below 2.3, expect a rapid repricing. Investors should watch the 4.95 percent level on the 10-year Treasury as the primary indicator of the next leg up in yields.