The Illusion of Stability at the 6000 Threshold
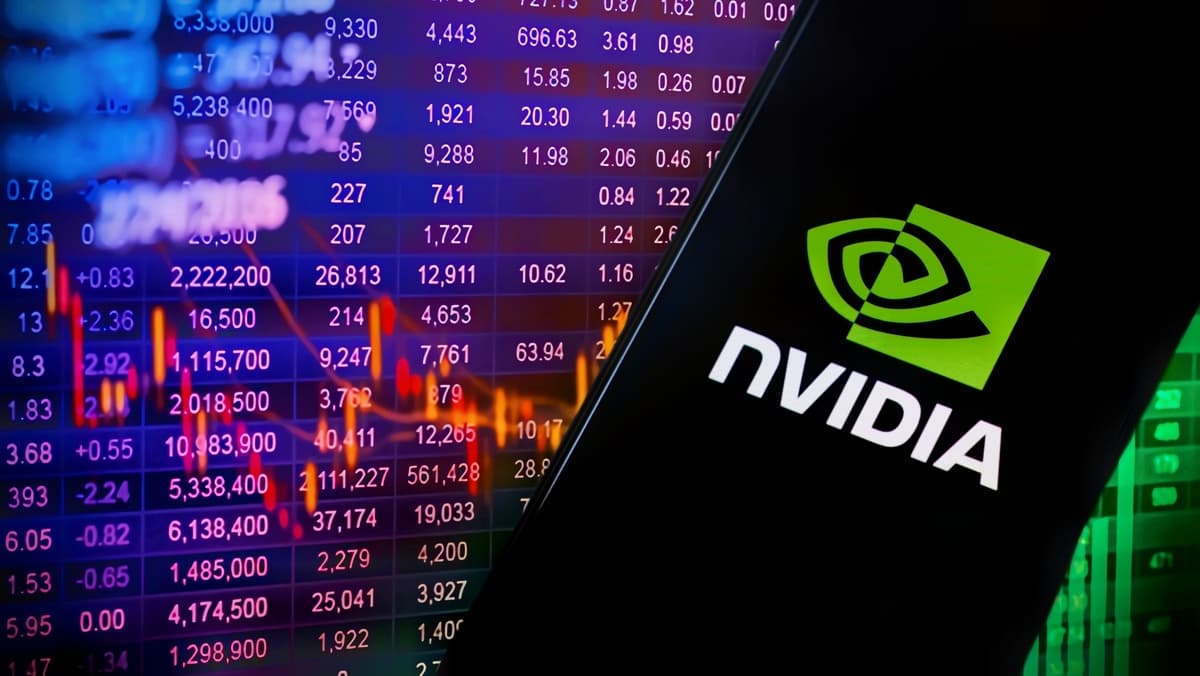
Liquidity is drying up fast. While the S&P 500 touched the 6,000 psychological barrier earlier this month, the 48 hours leading into November 22, 2025, reveal a market exhausted by its own momentum. The technical breakdown began on November 20, following Nvidia’s third quarter earnings release. Despite reporting a revenue beat at $39.2 billion, the guidance for Blackwell chip margins signaled a cooling period that the algorithm-driven desks were not prepared to digest. The immediate 3.2 percent drawdown in pre-market trading on November 21 acted as a catalyst for a broader de-risking trend across the Mag-7 complex.
Institutional outflows are accelerating. Data from the latest SEC 13F filings indicates that hedge fund exposure to mega-cap tech has dropped to its lowest level since January. The rotation into defensive utilities and consumer staples is not a sign of a healthy market, it is a flight to safety. Traders are no longer buying the dip; they are selling the rips. The benchmark 10-Year Treasury yield is currently hovering at 4.48 percent, a level that historically chokes equity valuations when the S&P 500 forward P/E ratio exceeds 22x. Today, that ratio sits at a precarious 24.1x.
Federal Reserve Hawkishness Re-Emerges
Jerome Powell has abandoned the dovish script. In his remarks at the Dallas Regional Chamber last week, Powell stated that the economy is not sending signals that the Fed needs to be in a hurry to lower rates. This was reinforced on November 21 by Federal Reserve Governor Michelle Bowman, who argued that progress on inflation appears to have stalled. The market is now pricing in only a 52 percent chance of a December rate cut, down from 84 percent just thirty days ago. Per recent Reuters market analysis, the discrepancy between Fed dot plots and market expectations is creating a volatility gap that VIX traders are aggressively exploiting.
The Sticky Inflation Trap
Inflation is not dead, it is merely hiding in the services sector. The October CPI report, released on November 13, showed a 2.6 percent year-over-year increase, but the core services component, excluding rent, is rising at an annualized rate of 4.1 percent. This “Supercore” inflation is what keeps the Fed up at night. The cost of labor in the healthcare and insurance sectors is rising, and these costs are being passed directly to the consumer. Small businesses are reporting that they can no longer absorb higher input prices, which suggests a second wave of price hikes is coming in early 2026.
| Economic Indicator | October 2024 | October 2025 (Current) | Trend Status |
|---|---|---|---|
| Headline CPI (YoY) | 2.4% | 2.6% | Rising |
| Core CPI (YoY) | 3.3% | 3.3% | Stagnant |
| 10-Year Treasury Yield | 4.01% | 4.48% | Rising |
| Unemployment Rate | 4.1% | 4.3% | Rising |
Credit spreads are widening. The gap between BAA corporate bonds and the 10-year Treasury has grown by 15 basis points in the last fortnight. This indicates that lenders are becoming wary of the debt-servicing capabilities of mid-sized firms. According to Bloomberg terminal data, corporate bankruptcies in the retail sector for Q4 have already surpassed the total for Q1 and Q2 combined. This is the mechanical reality of higher-for-longer interest rates finally breaking the back of the over-leveraged consumer.
Technical Breakdown of the Mag-7 Dominance
The concentration risk is terminal. The top seven stocks in the S&P 500 now account for 32 percent of the index total market capitalization. This is a higher concentration than what was observed during the 2000 Dot-com bubble. When Apple or Microsoft misses a single growth metric, the entire index suffers a systemic shock. On November 21, Apple’s supply chain reports from Asia indicated a 15 percent reduction in iPhone 17 component orders for the next quarter. This news alone wiped $85 billion off its market cap in ninety minutes. The lack of breadth in this rally means there is no floor if the tech giants stumble.
Geopolitical risk is now priced in daily. The escalation of trade rhetoric regarding South Asian manufacturing hubs has forced domestic importers to front-load inventories. This creates a temporary boost in GDP through inventory build-up but leads to a massive “bullwhip effect” that will crater demand in the coming months. Freight rates for trans-Pacific shipping have climbed 12 percent since November 1, adding another layer of cost to an already strained supply chain. These are not speculative fears; these are the realized costs of a fragmented global economy.
Watch the January 28 Fed Decision
The next critical inflection point occurs on January 28, 2026, when the Federal Open Market Committee will release its first interest rate decision of the new year. Market participants must monitor the 2-Year Treasury note yield, which currently sits at 4.28 percent. If this yield moves above the 4.40 percent mark before the end of December, it will signal that the bond market has completely priced out any hope of a soft landing, forcing a massive repricing of risk assets across the board.