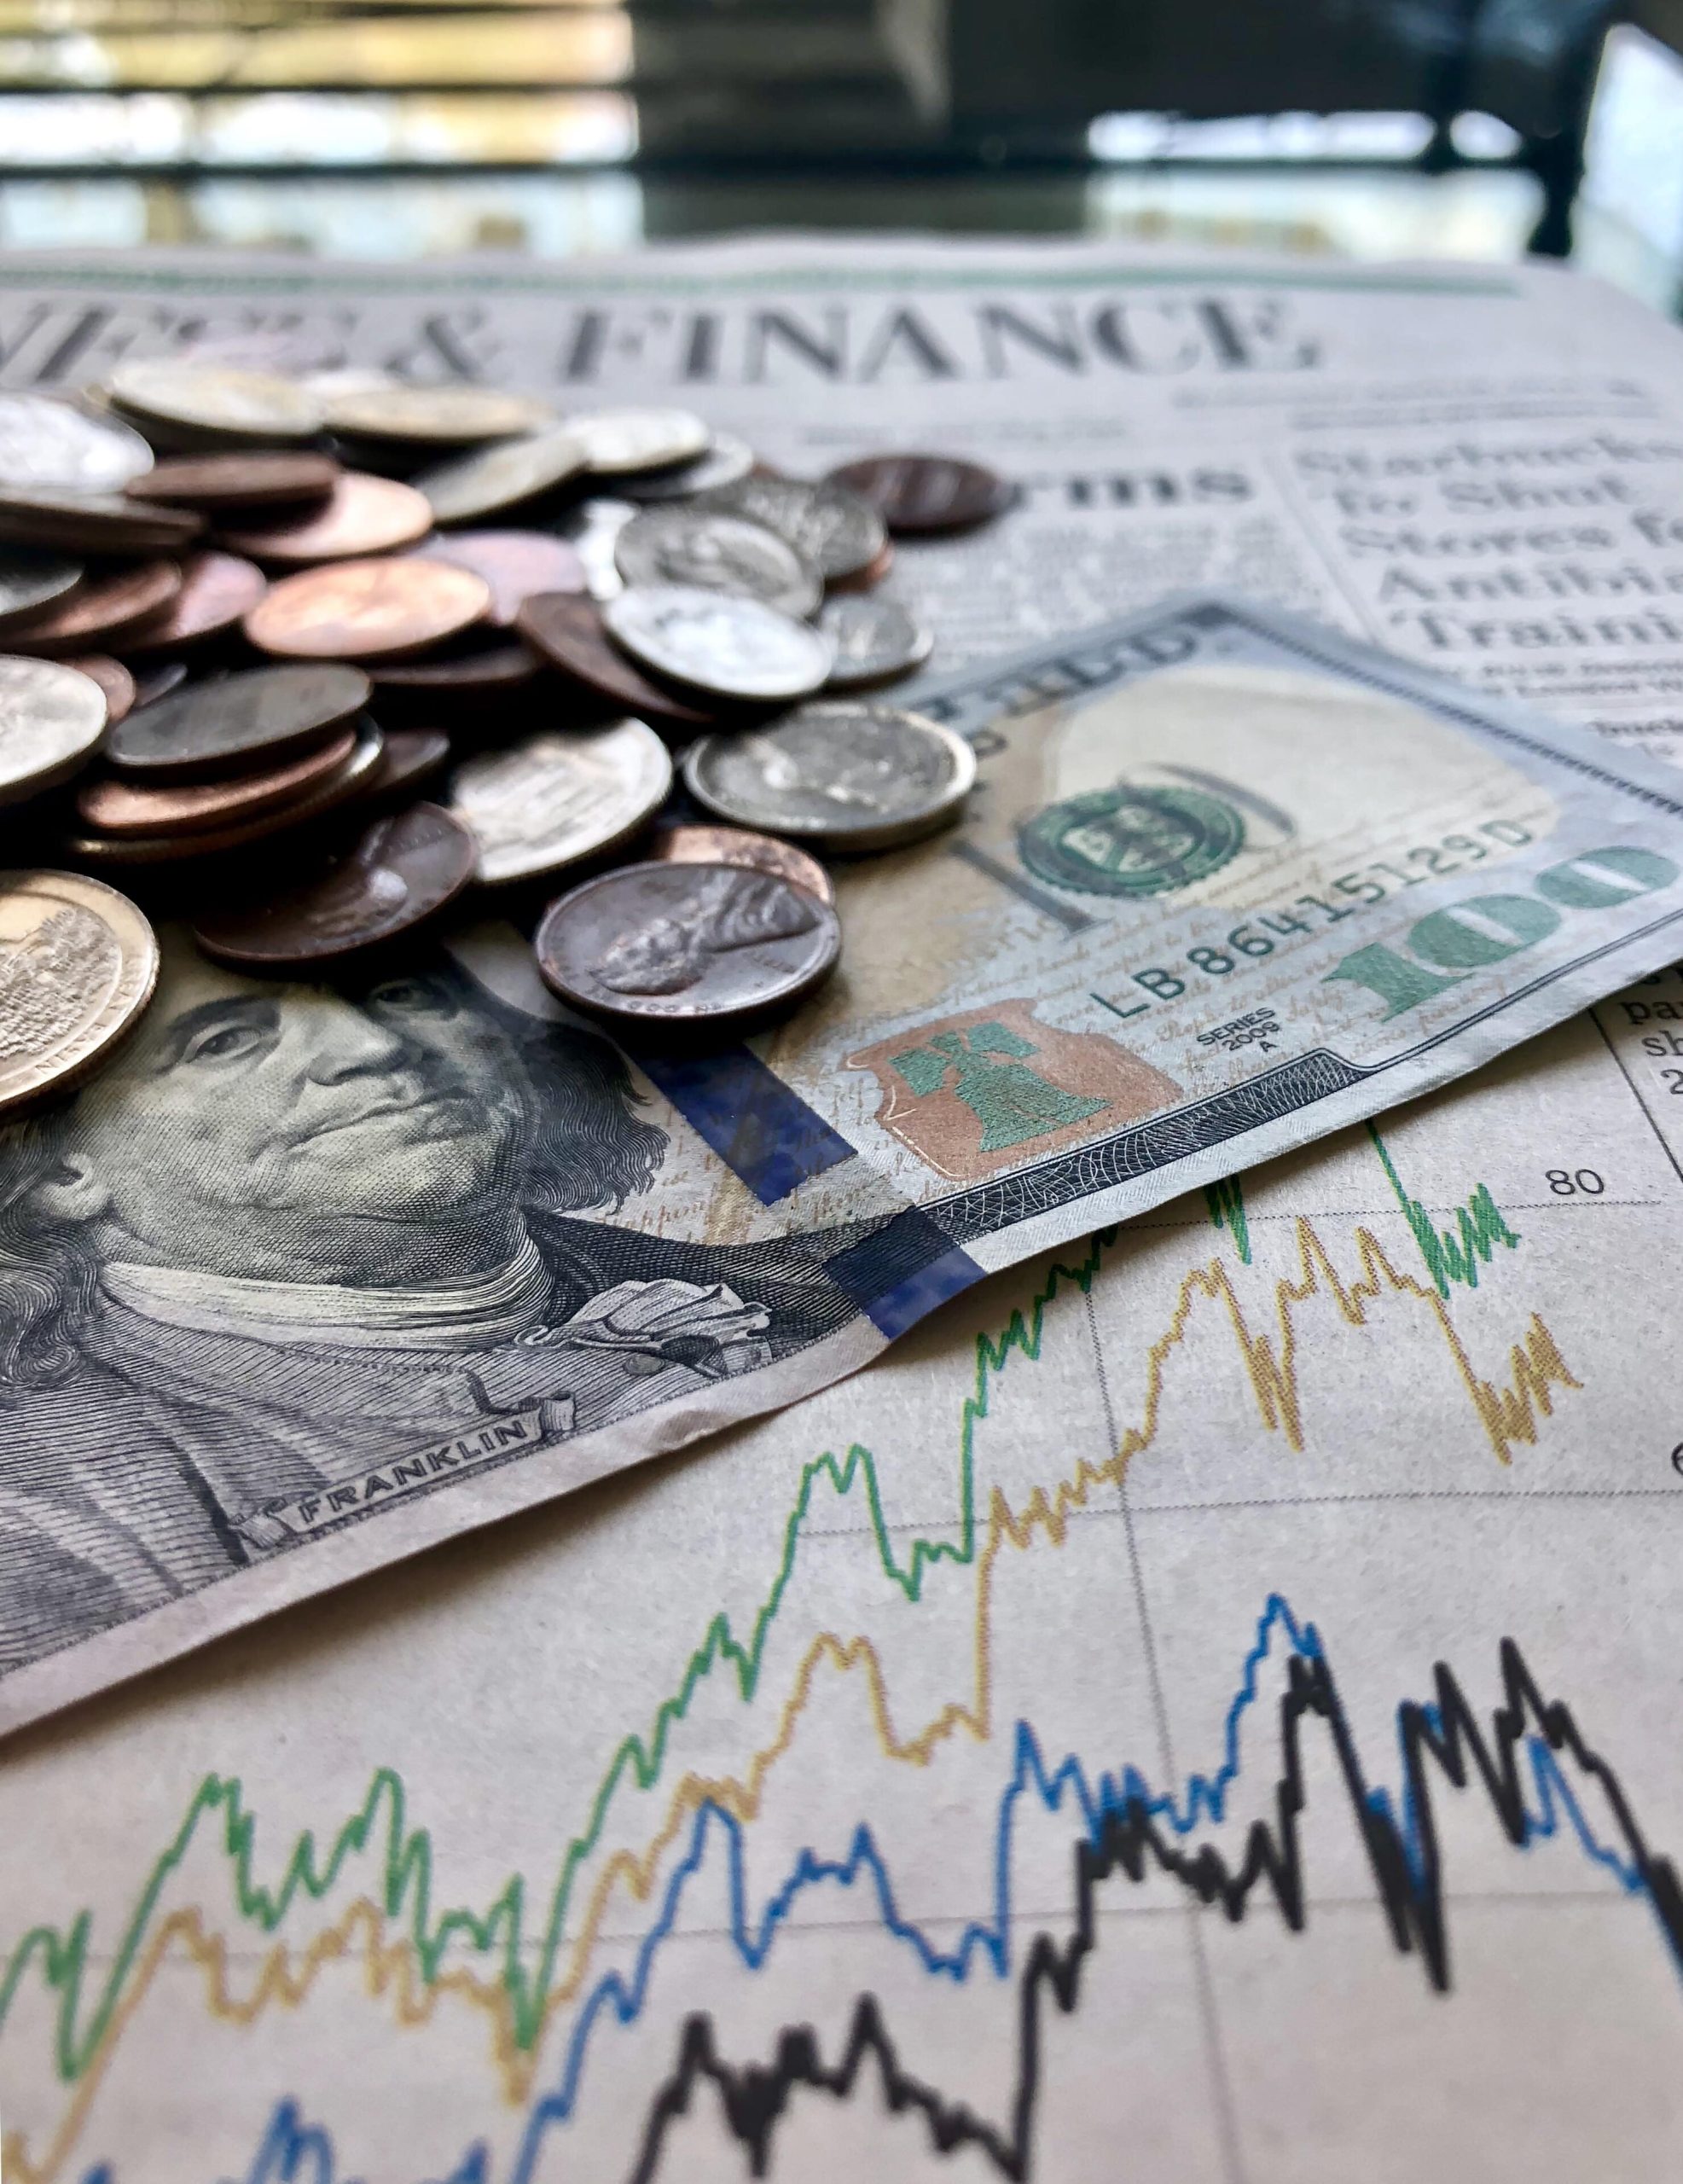
The Aggregate Lie
The headline numbers suggest a soft landing. Retail sales appear stable. GDP growth remains positive. But the aggregate data hides a structural fracture in the American economy. BlackRock’s recent analysis of the K-shaped consumer reveals a market split by wealth, health, and policy. The middle class is no longer a monolith. It is a ghost. High-income earners are decoupling from the rest of the population. They are insulated by asset inflation and AI-driven productivity gains. Meanwhile, the bottom 40 percent faces a triple threat of regressive tariffs, food-sector deflation, and stagnating real wages.
The bifurcation is measurable. Luxury spending and high-end services are accelerating. Discount retail and basic staples are cratering. This is not a cyclical dip. This is a permanent realignment of the domestic wallet. The resilience cited by institutional analysts is localized. It exists in ZIP codes with high concentrations of equity-based compensation. For the rest, the cost of living is a relentless grind. The data from the latest retail sentiment reports confirms that the gap between the ‘haves’ and the ‘have-nots’ has reached its widest point since the 2008 financial crisis.
The GLP-1 Deflationary Wave
Weight loss drugs are an economic wrecking ball. GLP-1 agonists like Ozempic and Wegovy have moved beyond the clinic and into the balance sheets of the S&P 500. The mechanism is simple. Reduced caloric intake leads to lower basket sizes. This is a direct hit to the Consumer Packaged Goods (CPG) sector. Large-scale food manufacturers are seeing volume declines that they cannot mask with price hikes. The ‘velocity of calories’ is slowing down. This impacts everything from freight logistics to supermarket shelf-space valuation.
Investors are fleeing traditional staples. They are rotating into healthcare and high-end wellness. The K-shape is visible here too. Those who can afford the $1,000-a-month prescriptions are changing their consumption patterns. They are buying less junk food and more high-protein, premium alternatives. Those who cannot afford the drugs remain stuck in the high-calorie, high-inflation cycle of processed foods. This creates a health-wealth gap that will manifest in long-term insurance premiums and labor productivity. The BlackRock Bid podcast highlights this as a primary driver of the new consumer reality.
Tariffs as a Regressive Tax
Trade barriers are the new normal. The recent escalation in import duties has created a hidden tax on the working class. High-end consumers do not feel a 15 percent increase in the price of a luxury handbag. They have the margin. Low-income consumers feel every penny of a 15 percent increase in imported electronics, apparel, and home goods. Tariffs are fundamentally regressive. They disproportionately target the goods that make up the bulk of a lower-income household’s budget.
Supply chains are fracturing. Companies are trying to ‘near-shore’ production, but the costs are being passed directly to the end-user. This creates a ceiling on discretionary spending for the bottom half of the K. While the top half benefits from a strong dollar and offshore investments, the bottom half is trapped in a localized inflationary loop. The divergence in purchasing power is not just a social issue. It is a systemic risk to the stability of the consumer-led economy. Per data from Bloomberg Markets, the correlation between consumer confidence and actual spending has broken down for the first time in decades.
Visualizing the K-Shaped Divergence
The following chart illustrates the divergence in spending power between the top 10% and the bottom 50% of households over the last six months. Note the widening delta as we move into March.
Consumer Spending Index: High-Income vs. Low-Income (Oct 2025 – March 2026)
The AI Productivity Premium
Artificial Intelligence is the final wedge. High-income professionals are using generative tools to augment their output and secure higher bonuses. They are the ‘knowledge workers’ who have successfully integrated AI into their workflows. On the other side of the K, AI is a threat. Automation in retail, logistics, and basic customer service is putting downward pressure on wages. The productivity gains from AI are not being shared equally. They are being captured by capital and high-skill labor.
This creates a feedback loop. High-income earners have more disposable income to invest in the very technology that is displacing lower-income workers. The stock market reflects this. Tech giants are hitting record valuations while companies focused on the ‘value’ consumer are struggling to maintain margins. The market is betting on a future where the top 20 percent of consumers drive 80 percent of the growth. It is a high-stakes gamble on a fractured society.
Sector Performance Comparison
The table below breaks down the year-over-year performance of sectors most affected by the K-shaped trend.
| Sector | Growth (YoY) | Primary Driver |
|---|---|---|
| Luxury Goods | +18.4% | Asset Inflation |
| High-End Wellness | +22.1% | GLP-1 Adoption |
| Big Tech | +14.7% | AI Productivity |
| Discount Retail | -6.2% | Tariff Pressure |
| Mass Market CPG | -9.8% | Reduced Caloric Intake |
The next data point to watch is the April 15 tax receipt report. If high-income receipts continue to outpace the general population, the Fed will be forced to maintain higher rates to cool the top end, even as the bottom end enters a recession. The divergence is no longer a theory. It is the defining feature of the 2026 economy.