The end of the fiat illusion
Gold hit $5,500 this morning. The markets are in shock. Institutional desks are paralyzed. This is not a standard rally. It is a systemic rejection of the dollar. For decades, the yellow metal was a relic. Today, it is the only remaining arbiter of value. The velocity of this move suggests a total loss of confidence in Western central bank policy. When gold moves 15 percent in a week, the math of the global debt market stops working.
Silver shatters the glass ceiling
Silver has crossed $120 per ounce. This represents a historic compression of the gold to silver ratio. Industrial demand for photovoltaics and high-end semiconductors is colliding with a massive short squeeze. The physical market is broken. Delivery delays at the London Bullion Market Association are now stretching into months. Paper contracts are being settled in cash because the vaults are effectively empty. Investors are no longer interested in promises. They want the metal in their hands.
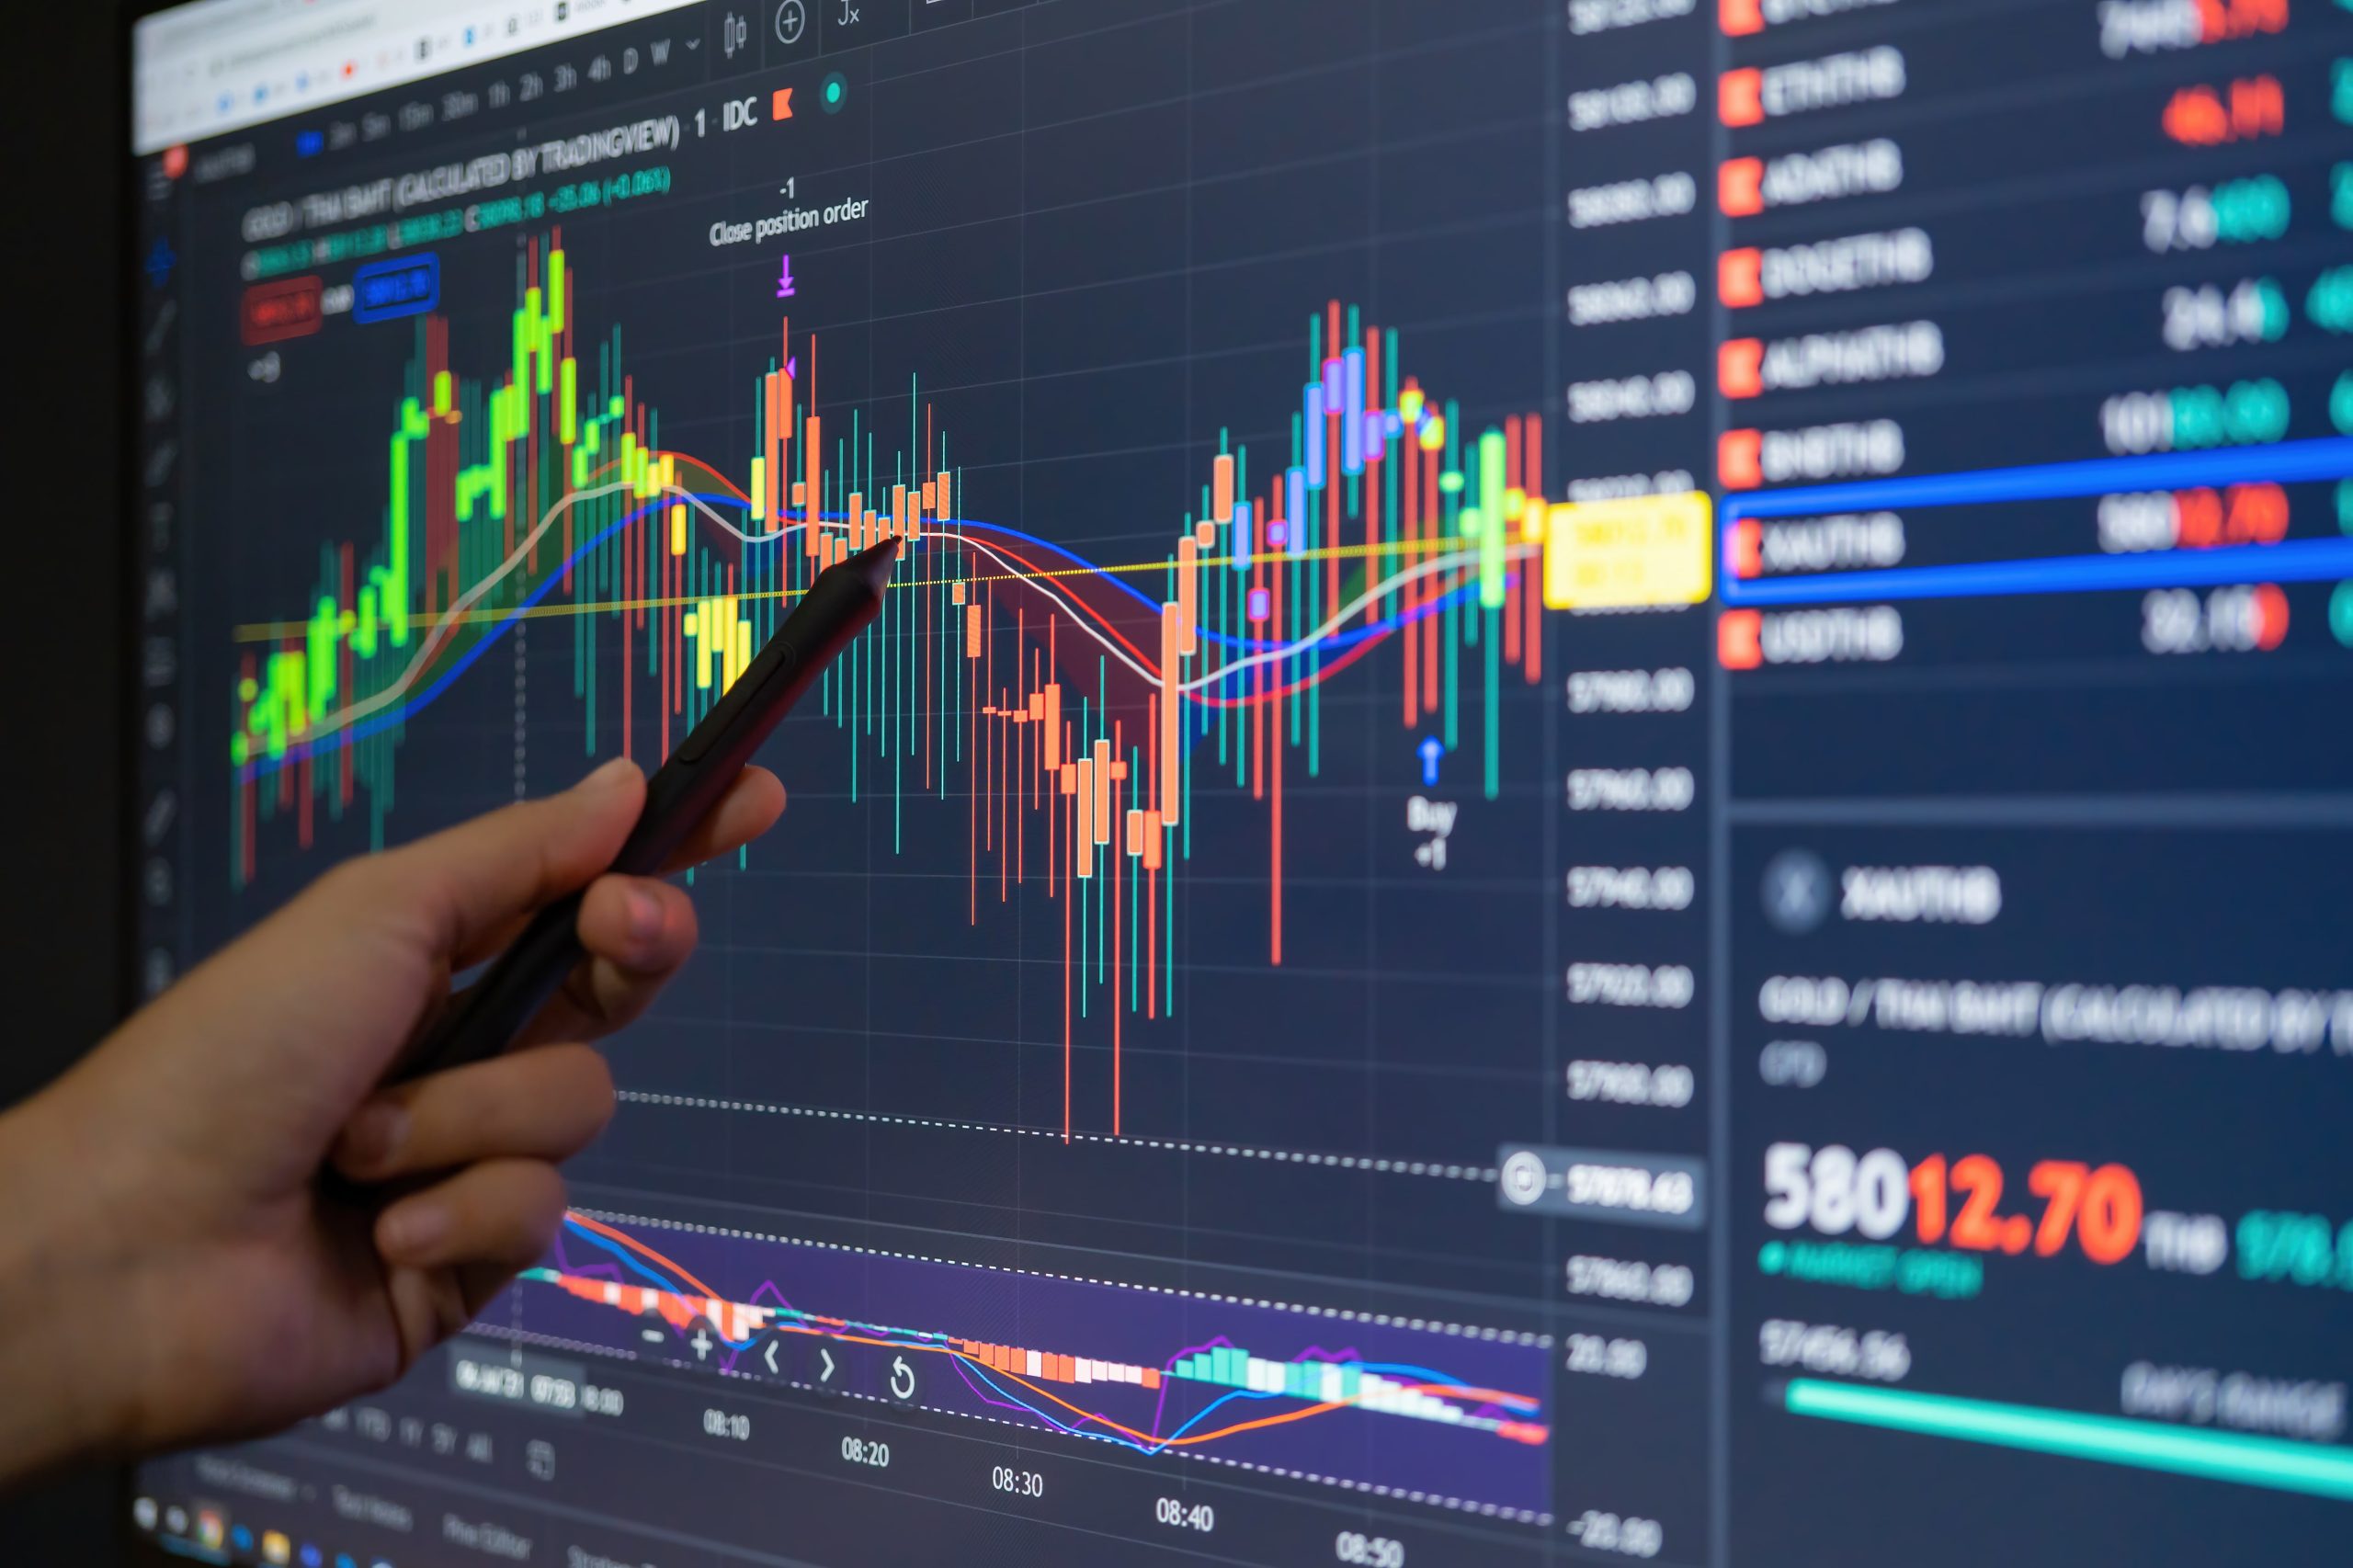
Visualizing the Parabolic Ascent
The following data represents the monthly closing price of Gold leading up to today, January 29, 2026. The trajectory shifted from linear to exponential in the final quarter of last year.
The mechanics of the collapse
Central banks are the primary drivers. According to latest reports from Bloomberg Commodities, the BRICS+ nations have accelerated their gold accumulation to record levels. They are preparing for a multi-currency reserve system. This has triggered a feedback loop. As the price rises, the value of dollar-denominated bonds held by these nations falls in relative terms. They sell the bonds to buy more gold. The yield on the 10-year Treasury is spiking in tandem. This is the definition of a debt trap. The Federal Reserve cannot raise rates to fight inflation without bankrupting the Treasury, but they cannot lower rates without fueling the gold fire.
Institutional capitulation
The retail market is already priced out. Most transactions are now occurring at the sovereign level. Market data from Reuters indicates that exchange-traded funds (ETFs) saw a record $14 billion inflow in the last 48 hours alone. This is panic buying. It is the sound of the world’s largest hedge funds admitting they were wrong about the permanence of the dollar’s purchasing power. Even the most conservative wealth managers are now recommending a 20 percent allocation to hard assets. This was unthinkable two years ago.
Comparative Market Performance
The divergence between hard assets and traditional equities has reached a breaking point. While the S&P 500 struggles with stagnant earnings and rising input costs, the commodities sector is entering a super-cycle.
| Asset Class | Price (Jan 29, 2026) | 24-Hour Change | Year-to-Date Change |
|---|---|---|---|
| Gold (Spot) | $5,512.40 | +4.2% | +21.5% | Silver (Spot) | $121.15 | +6.8% | +34.2% | USD Index (DXY) | 92.40 | -1.1% | -8.4% | 10-Year Treasury Yield | 5.85% | +12bps | +45bps |
The technical breakdown
Technical analysts are throwing out their old charts. Resistance levels at $3,000 and $4,500 were breached with zero consolidation. This indicates a lack of sellers. When the price moves this fast, it means the supply side of the equation has evaporated. Mining companies are hoarding their own production. They realize that the gold in the ground is more valuable than the cash they would receive for selling it. This is a supply-side shock that no interest rate hike can solve. The market is now looking for a new floor, and it is nowhere in sight.
The focus now shifts to the upcoming February 14th Consumer Price Index release. If the headline inflation number exceeds 8 percent, the psychological barrier of $6,000 for gold will likely be tested before the end of the quarter. Watch the COMEX delivery notices closely. If the failure-to-deliver rate continues to climb, the spot price will decouple entirely from the futures market.