The Era of Easy Volatility is Over
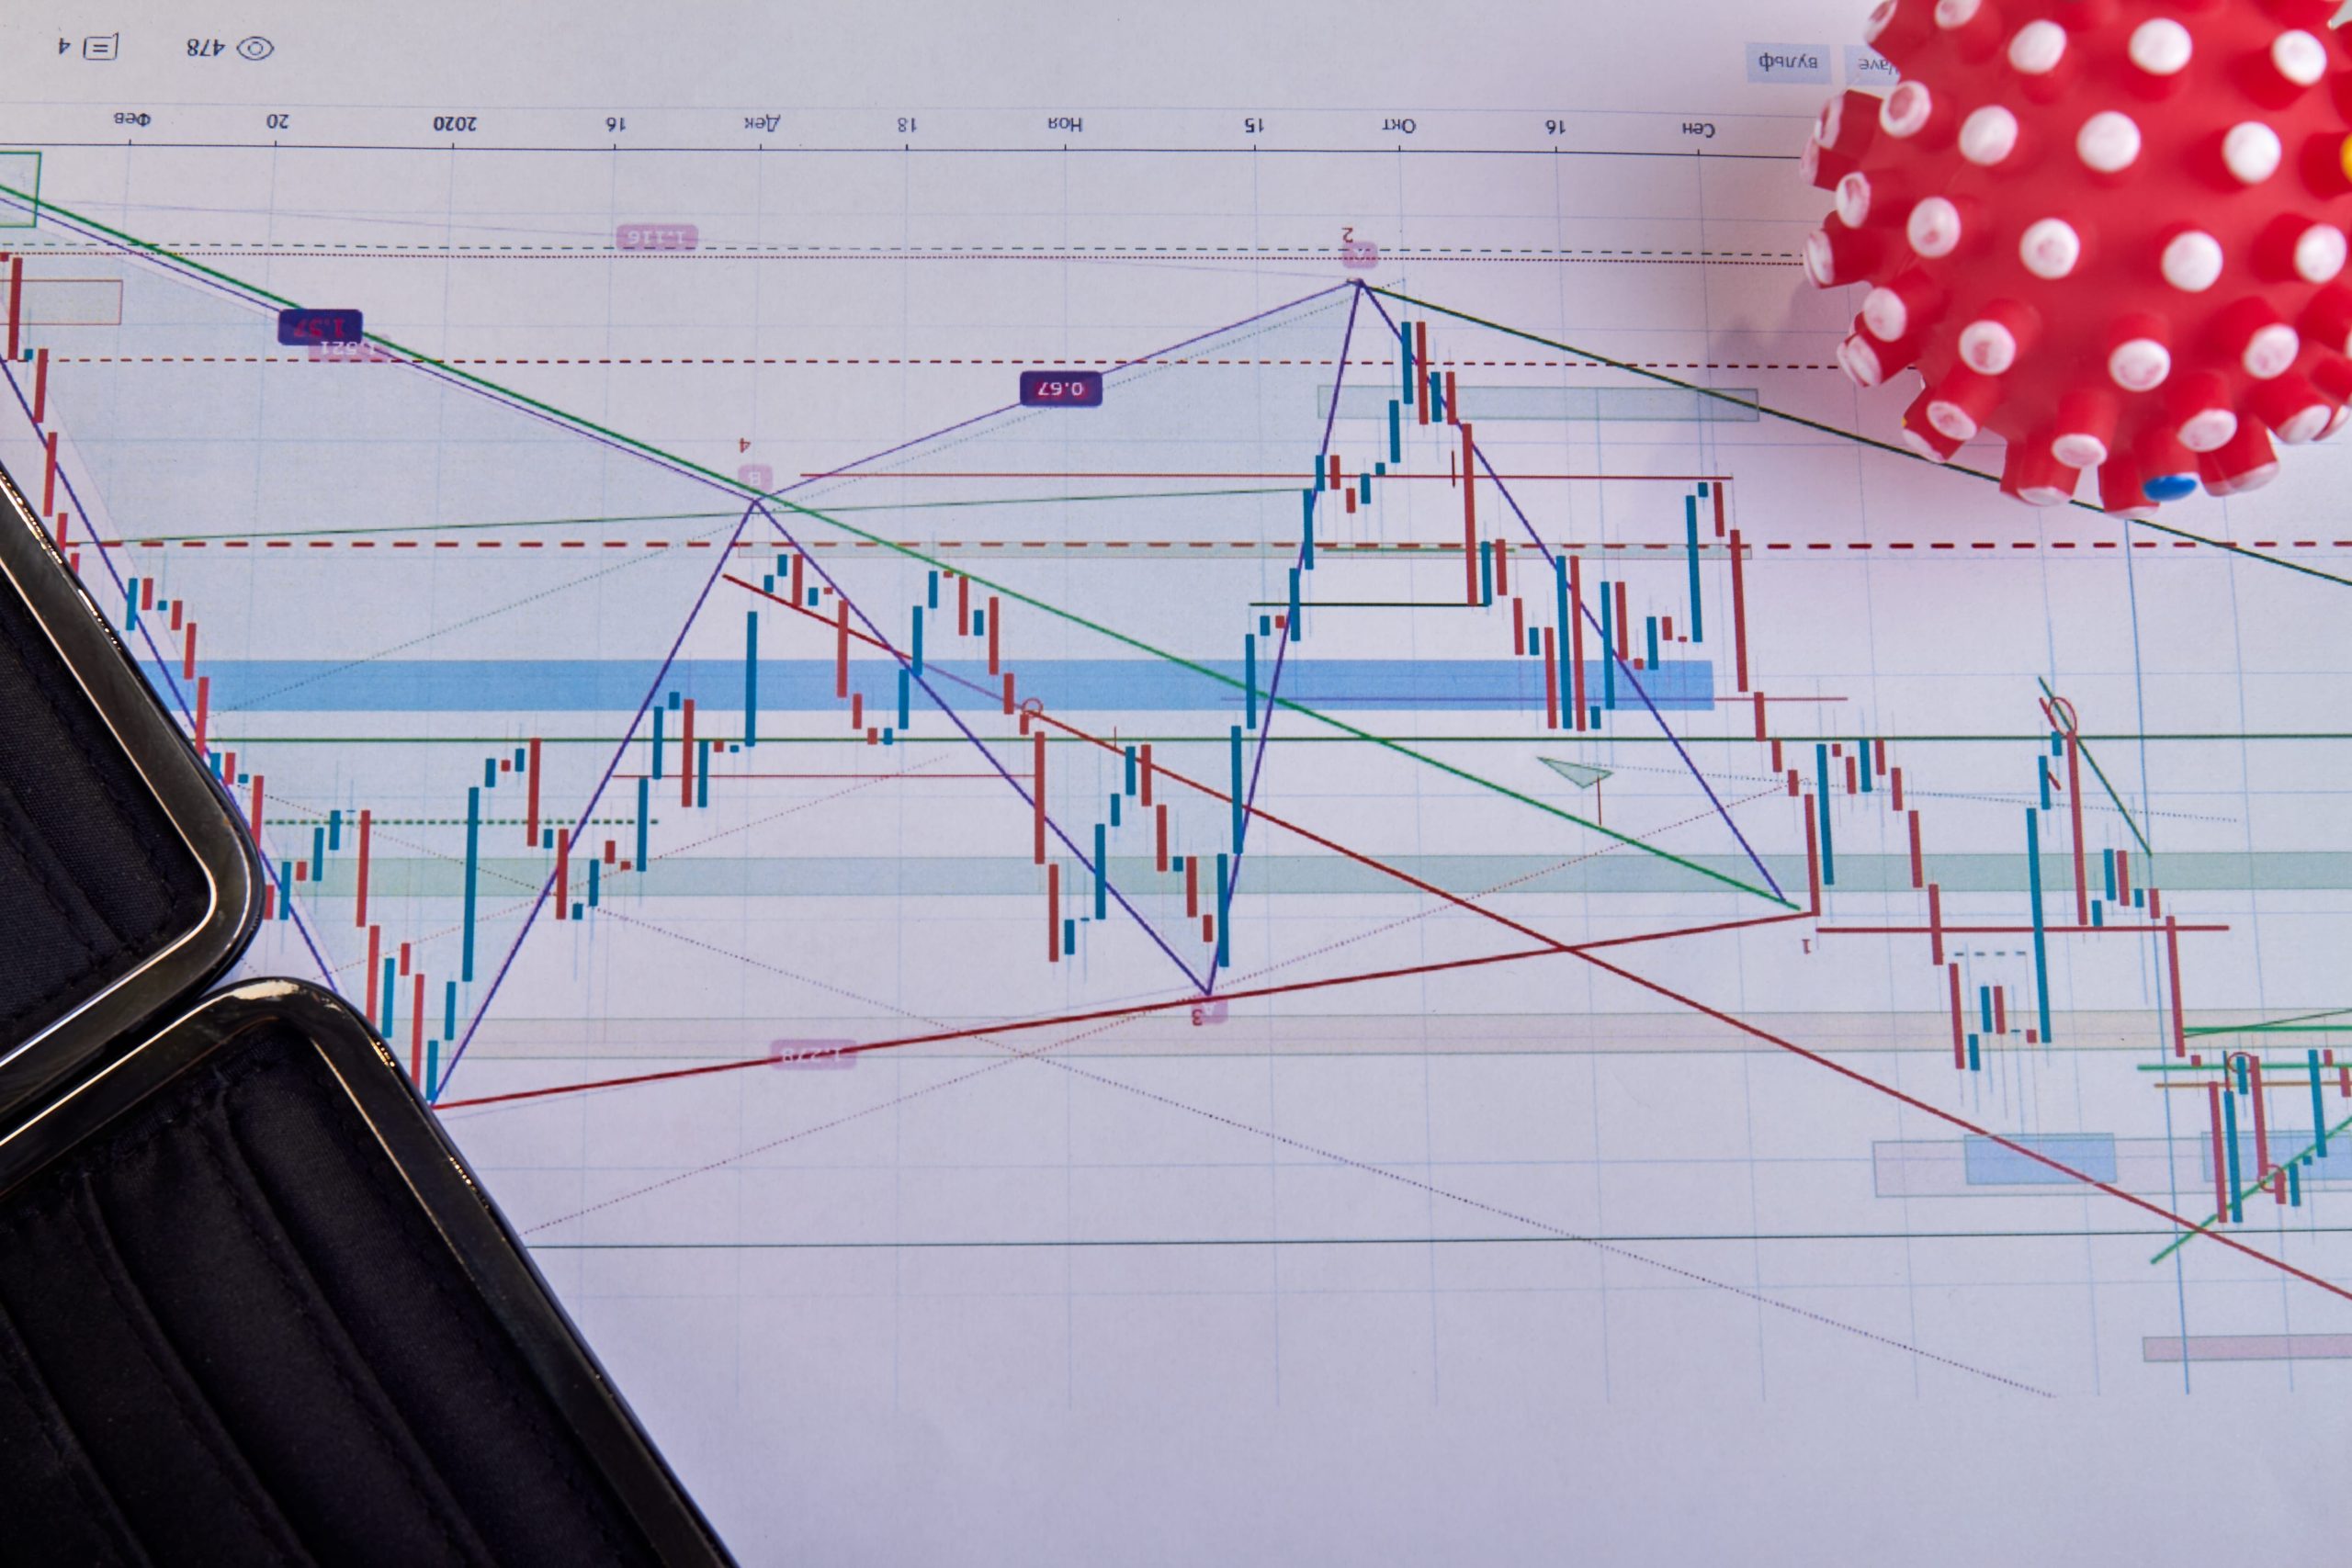
Retail traders spent the last decade conditioned to buy every 1% dip. That muscle memory is now a liability. On Friday, October 10, 2025, the Producer Price Index (PPI) print hit the wires at 0.4% higher than consensus, sending the 10-Year Treasury yield screaming toward 4.85%. This was not a fluke. It was the final signal that the liquidity regime of 2024 has officially evaporated. Intraday trading in this environment is no longer about following trends; it is about surviving the hunt for liquidity by institutional algorithms that have mapped retail stop-loss clusters with predatory precision.
The 0DTE Gamma Trap
The most significant shift in late 2025 is the total dominance of Zero Days to Expiration (0DTE) options. These contracts now account for nearly 60% of total S&P 500 option volume. When a trader buys a call, the market maker must hedge by buying the underlying asset. This creates a feedback loop. However, the mechanism has inverted. Instead of providing a floor, the massive concentration of 0DTE positions at specific strike prices creates a vacuum. If a price level breaks, the subsequent hedging creates a ‘gamma squeeze’ in reverse, leading to the 50-point candles we witnessed during the final hour of trading on October 10.
Institutional vs Retail Flow Disparity
Data from the Securities and Exchange Commission suggests that retail participation in standard equity intraday trades has dropped 22% year-over-year. The ‘smart money’ has moved into complex multi-leg spreads that retail platforms struggle to execute without significant slippage. This shift creates a tiered market where the individual trader is fighting for scraps in a high-frequency environment dominated by sub-millisecond execution speeds.
The Mechanics of Information Asymmetry
The gap between past assumptions and the current reality is most visible in the failure of traditional technical indicators. The Relative Strength Index (RSI) used to be a reliable gauge of exhaustion. In 2025, RSI is being actively ‘gamed.’ Large players are aware that retail bots trigger at the 30 and 70 levels. Consequently, we are seeing ‘RSI bleeding,’ where a stock remains in an oversold state for hours as price continues to crumble, wiping out those who tried to catch the falling knife based on 2015-era textbooks.
Arbitrage is now focused on latency. Per Bloomberg’s October 12 report, the spread between the cash market and futures has widened to levels not seen since the 2020 crash. This is a clear indicator of a broken plumbing system. Traders who are not using direct-market access (DMA) are essentially trading against a ghost of the price that existed 500 milliseconds ago.
Comparison of Market Regimes
| Metric | Oct 2024 Average | Oct 2025 Actual |
|---|---|---|
| 0DTE Option Volume (% of Total) | 42% | 59% |
| Average Hourly S&P 500 Range | 12 Points | 28 Points |
| VIX Correlation to Bond Yields | Moderate | Extreme High |
Liquidity Fragmentation and the Death of the Pivot Narrative
The market spent the first half of 2025 dreaming of a aggressive rate cuts. The data released this morning, October 13, suggests the opposite. With the core inflation rate stubbornly anchored at 3.2%, the Federal Reserve’s path is narrowing. This ‘higher for longer’ reality is causing a liquidity fragmentation. Capital is being pulled out of speculative intraday favorites like mid-cap tech and forced into ‘fortress’ balance sheets. This creates a dangerous environment where the top five stocks in the S&P 500 are the only ones with sufficient depth to trade intraday without 2% slippage.
Technical setups like the ‘Cup and Handle’ or ‘Head and Shoulders’ have lost their predictive power because the underlying volume is no longer human. It is the result of recursive loops. To trade successfully today, one must understand ‘order flow toxicity.’ This occurs when the market is dominated by informed flow, leaving the uninformed retail trader as the only counterparty. If you find yourself in a trade that feels too easy to enter, you are likely the liquidity being harvested.
The focus must shift from price patterns to the volatility term structure. According to Reuters analysis of the yield curve, the spread between the 2-year and 10-year notes is finally de-inverting. Historically, this is the moment when the real damage occurs. The de-inversion is not a sign of health; it is a sign that the short-term credit market is finally pricing in a hard landing. Intraday traders should watch the 4.90% level on the 10-year yield. A break above that level this week will trigger a systematic deleveraging event that will make current volatility look like a calm pond.
Looking ahead to the first fiscal quarter of 2026, the critical milestone will be the January 14 Fed meeting. The market is currently pricing in a 65% chance of a ‘hawkish hold.’ If the dots plot shows any upward revision for 2026 terminal rates, the current intraday support levels at 5,400 on the S&P 500 will be tested with extreme prejudice. Watch the January 2026 LIBOR-replacement spreads for the first sign of this structural shift.